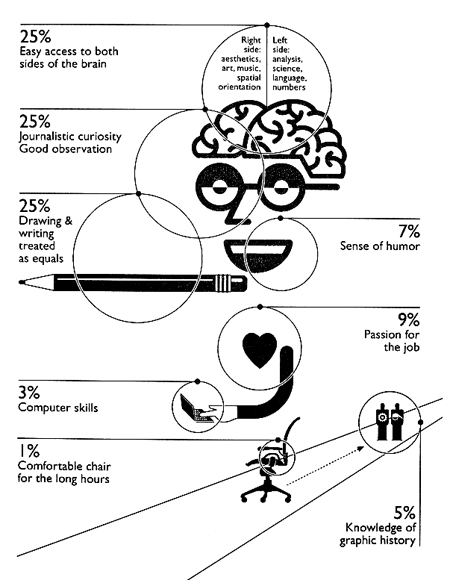
This is a “self-portrait” by Nigel Holmes from Steven Heller’s book, Nigel Holmes on Information Design, that came to me by way of Mark Larson by way of Michael Surtees:

My chart might look like this:
- 25% easy access to both sides of the brain
- 25% drawing and writing treated as equals
15% curiosity10% computer skills- 25% sense of humor
- 25% curiosity about the world
I changed my list. That sense of humor is important — as is curiosity.
http://doorsdown.blogspot.com/
has some of my comix from the 70s and a current comix. I look at them and relate to your questions and thoughts. I also do information design, but within such conservative constraints that the results bore me silly.
I’m what I would term as a ‘traditional’ information designer, working mostly on non-web projects, and my chart would look something like:
• 20% easy access to both sides of the brain
• 20% curiosity about the world/observation
• 15% pedant
• 20% design and writing treated as equals
• 5% computer skills (as I work alone I have to have them)
• 4% sense of humour
• 15% passion for the job
• 1% mathematician
Following of from Zeitguy’s comment that “I also do information design, but within such conservative constraints that the results bore me silly” I think this is largely down to a passion for the kind of work involved. I have no shame in standing up and saying “I design forms” and I find the work fascinating, seeing the ‘conservative constraints’ as a challenge rather than a barrier.
It’s definitely a job that involves a certain type of personality to do it well
i work as a comunicational designer and this are my weird numbers:
25% easy access to both sides of my brain
40% curiosity and good observation
15% drawing( i’m better writing)
10% passion for my job
5% computer skills (could be more)
3% sense of humor
2% graphic history
o% comfortable chair